
It’s a bit like a right-back scoring a worldie overhead kick from outside the area into the postage stamp. If you’re a right-back, you know you’re not getting the headlines very often but you also know that if you do your job properly, the Ronaldo’s and Messi’s of this world will do theirs, win the trophies and earn the real money; everybody wins.
The analogy works for the property market. We all want to let the 40,000 ft2 Mayfair property to a hedge fund for £140 per square foot but for every one of these mega-deals, there are hundreds of smaller deals being done every week – conspicuous by their absence in most analysis reports – that are as important to the health of the market at both ends.
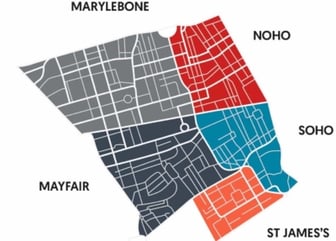
This is why we have compiled the first market report (that we are aware of) that focusses solely on the sub-markets. It provides an in-depth analysis of how each of the core West End markets – Mayfair, St. James’s, Marylebone, Noho and Soho – operate.
BDGSP partner Greg Porter said, ‘There is a considerable amount of research covering the West End office market but we always felt that what was available missed some of the important messages.’
You can view the full report here but the headlines make for very interesting reading:
-
Q1 2017 take-up rallied to 562,385 ft2 – up 30% on Q4 2016 buoyed by increased activity in the Noho and St James’s sub markets
-
Smaller lettings (<2,500 ft2) account for around 25% of market activity and is a key driver for the setting of prime rents
-
Availability in the core West End markets stands at 2.7m ft2, around 6.3% of total built stock with the majority in Mayfair (831,000 ft2) – a y-o-y increase
-
The smallest stock availability is in Marylebone – around 3.6% of total built stock
Greg continues; ‘We are seeing prime rents come under pressure in some of the West End submarkets but the past three months has seen a new peak rent of £190 per square foot set at 5 St James’s Square on a 3,400 ft2 letting. In addition to this, the Soho market has seen prime rents continue to improve, rising to £105 per square foot driven largely by demand by the Design, Advertising Media, IT and Telecoms sector.’
Naturally with the looming uncertainty of Brexit and everything that entails it’s likely there will be a higher than average attrition rate over the next 18 months or so but, concludes Greg ‘we felt that there were some interesting messages that needed to be given about the West End market and we hope that our new perspective – published every six months – will help our clients to better understand what the ‘true’ drivers are of the diverse West End sub markets.’
For more information about the core sub markets, or indeed any of the West End commercial property markets, call us on 020 7629 1088 or email info@bdgsp.co.uk.
Share this

How COVID-19 Changed The Core West End Office Market

West End Offices Sub Markets Research Q3 2022
No Comments Yet
Let us know what you think